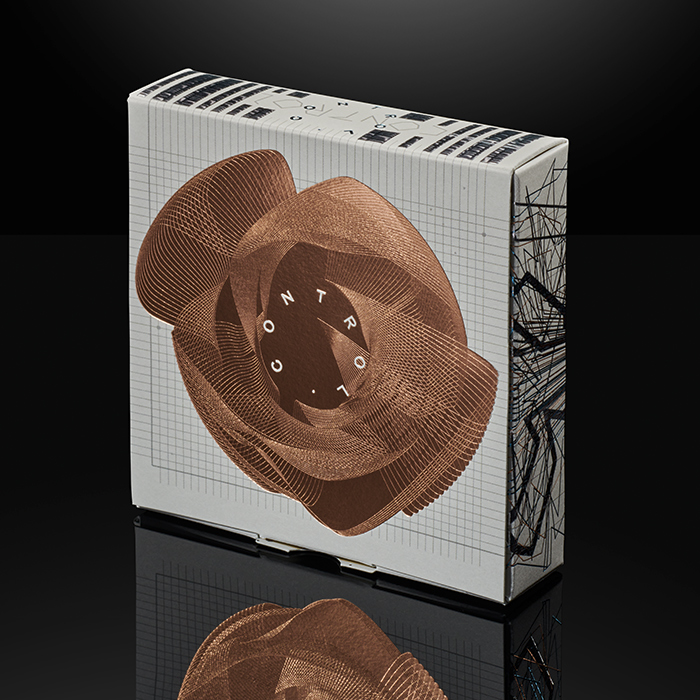
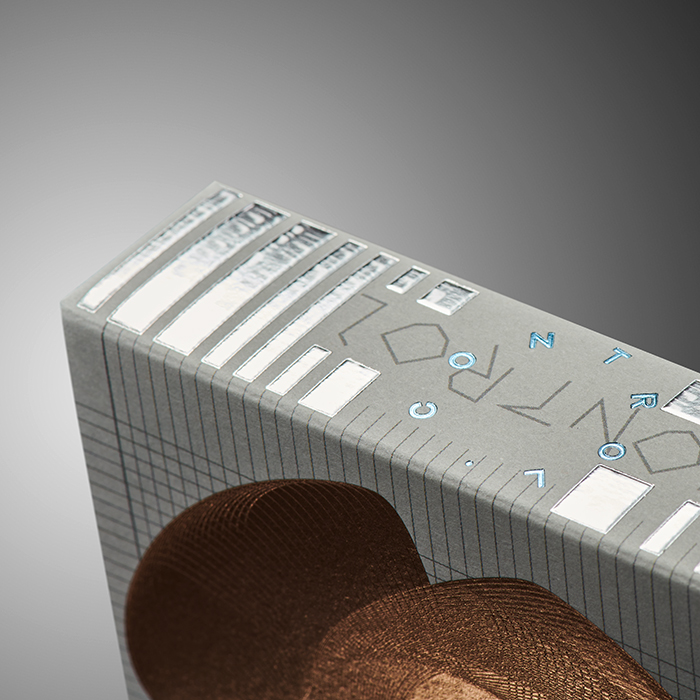
#2 Control. Data visualization is used to make huge amounts of numbers comprehensible with circular, round, spiral, linear and all sorts of other diagrams, dots and lines. To stay in control. What at first seems chaotic is in fact meticulously thought through. By giving data shapes, stern numbers can be turned into playful geometry. In this design there is a rhythm that almost turns into a kind of poetry. But just in case the information cannot be decoded , you can always reset.